Orhan Yavuz
Data Scientist & Software Engineer
Linear-Regression-1
Part 1 - What is it?
Introduction
Understanding linear regression is a prerequisite to understanding more complex machine learning models.
This is because linear regression is the simplest model-based machine learning method.
But what exactly is a "model"?
What are models?
A model is an (often simplified) representation of phenomena that occurs in the real world.
A statistical or machine learning model often requires data related to the phenomena that it is trying to model.
What is regression?
Simply put, regression is the study of dependence between variables.
More often than not, we are more interested in a specific variable which we call the response variable.
We often use one or more explanatory variables in order to study their relationship to the response variable, the one we are more interested in.
import matplotlib.pyplot as plt
import pandas as pd
%matplotlib inline
trees=pd.read_csv("trees.csv")
trees.index=trees.index.map(lambda x:"Tree "+str(x+1))
trees.head()| Girth | Height | Volume | |
|---|---|---|---|
| Tree 1 | 8.3 | 70 | 10.3 |
| Tree 2 | 8.6 | 65 | 10.3 |
| Tree 3 | 8.8 | 63 | 10.2 |
| Tree 4 | 10.5 | 72 | 16.4 |
| Tree 5 | 10.7 | 81 | 18.8 |
This is what our trees data looks like.
We have information on the Girth, Height, and Volume of each tree.
trees.plot.scatter(x="Girth",y="Volume")
plt.title("Tree Data")
plt.show()
Typically we would place our response variable in the y axis, and explanatory variable in the x axis.
Example
Suppose I am interested in understanding why trees have a specific volume.
The relationship between the volume and other properties of the tree can be modeled.
There are many forces of nature such as gravity, carbon dioxide levels, minerals in the soil, etc that affects what a tree's volume might be. In "modeling" this relationship, we are greatly simplifying the true relationship by only trying to describe a tree's volume using the data that we have at our disposal.
In this case, since I am specifically interested in the volume, we would choose this as our response variable.
The explanatory variables would be whatever data I have related to the girth, such as the height or volume of the tree.
What does regression help us do?
Regression helps us understand the relationship between the response variable and the explanatory variables.
After we have created the linear regression model, we can use it to predict response variables using the explanatory variables.
What is Linear?
Now we understand that models help us create simpler versions of things that exist in the real world using data.
We also understand that Linear Regression is the simplest model that we can create.
But what does the "linear" part in linear regression mean?
You can probably go on wikipedia and read a much more detailed explanation of the distinction, but we will briefly talk about it here.
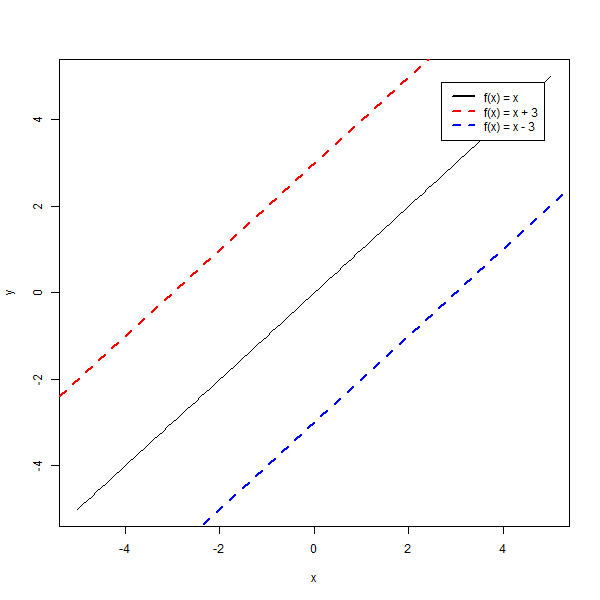
Linear Functions
In the simplest of terms, linear functions are functions whose graph is a straight line.
This means that the function will have a fixed "slope" or derivative as the x value changes.

Here are some examples of linear functions.
You can see that all these functions essentially are straight lines.
The amount that the y value changes with respect to the x value is constant throughout the entire graph.
NonLinear Functions
With the lack of a better definition, NonLinear functions are all functions that are not linear.
A more mathematical description would be functions where the output variable y is not proportional to the input variable.
This means that the change in y per change in x is different on different points of the graph, resulting in a graph that does not look like a line.

What does this mean for Linear Regression?
This means that we can use linear regression in order to model relationships between variables that are approximately linear.
Of course in practice, we never see data that is perfectly linear. However, whether or not a linear model is feasible for your use case shouldn't be too hard to determine as seeing a linear pattern is not too hard.
import seaborn as sns
sns.pairplot(trees)
plt.show()
If we plot all the columns against each other we can see the relationship between each variable.
Since our response variable is the Volume, lets try to model its relationship with one of the other variables.
Since we are using linear regression, we have to make sure that the relationship that we are trying to model is in fact, linear.
We can see that the Volume has an approximately linear relationship with the height, so we will model the Volume using Girth.
Lines
You might remember the concept of a line equation from middle school.
It has the following formula
y = mx + b
The Slope (m)
The slope represents the steepness of the line.
0 is not steep at all (horizontal line)
1 is the steepest possible line (a vertical line)
negative slopes are flipped with respect to the x axis because the y values are switching signs.

The Intercept (n)
The intercept is how much the line is shifted up or down vertically.
With the intercept set to 0, any line that we could draw would go through the origin (0,0).